


Table of contents
- Introduction:
- Step 1: Gathering the Tools 🧰
- Step 2: Peeking into the Data 👁️
- Step 3: Creating a Contingency Table 📊
- Step 4: Observing the Evidence 🕵️♀️
- Step 5: Launching the Investigation 🚀
- Step 6: Uncovering the Truth 🧐
- Step 7: Setting the Scene 🎭
- Step 8: Solving the Mystery 🧩
- Step 9: Delivering the Verdict 📜
- Step 10: Wrapping Up 🎁
Introduction:
Are you ready to embark on a data detective mission? The Chi-Square Test is a powerful tool that can help you uncover hidden associations in categorical data. In this practical guide, we'll take you through the Chi-Square Test step by step while explaining its significance at every stage. We'll be using the "A Waiter's Tips" dataset, which you can find here on Kaggle.
Step 1: Gathering the Tools 🧰
Before we begin, let's gather the necessary tools:
import scipy.stats as stats
import pandas as pd
import numpy as np
import seaborn as sns
import matplotlib.pyplot as plt

# Load the dataset
dataset = pd.read_csv('tips.csv')
In this step, we import essential libraries like scipy, pandas, seaborn,matplotlib and numpy. We also load our dataset, "A Waiter's Tips."
Step 2: Peeking into the Data 👁️
It's crucial to get familiar with the dataset. Let's take a sneak peek:
dataset.head()
This code snippet displays the first few rows of our dataset, allowing us to see the structure of our data.
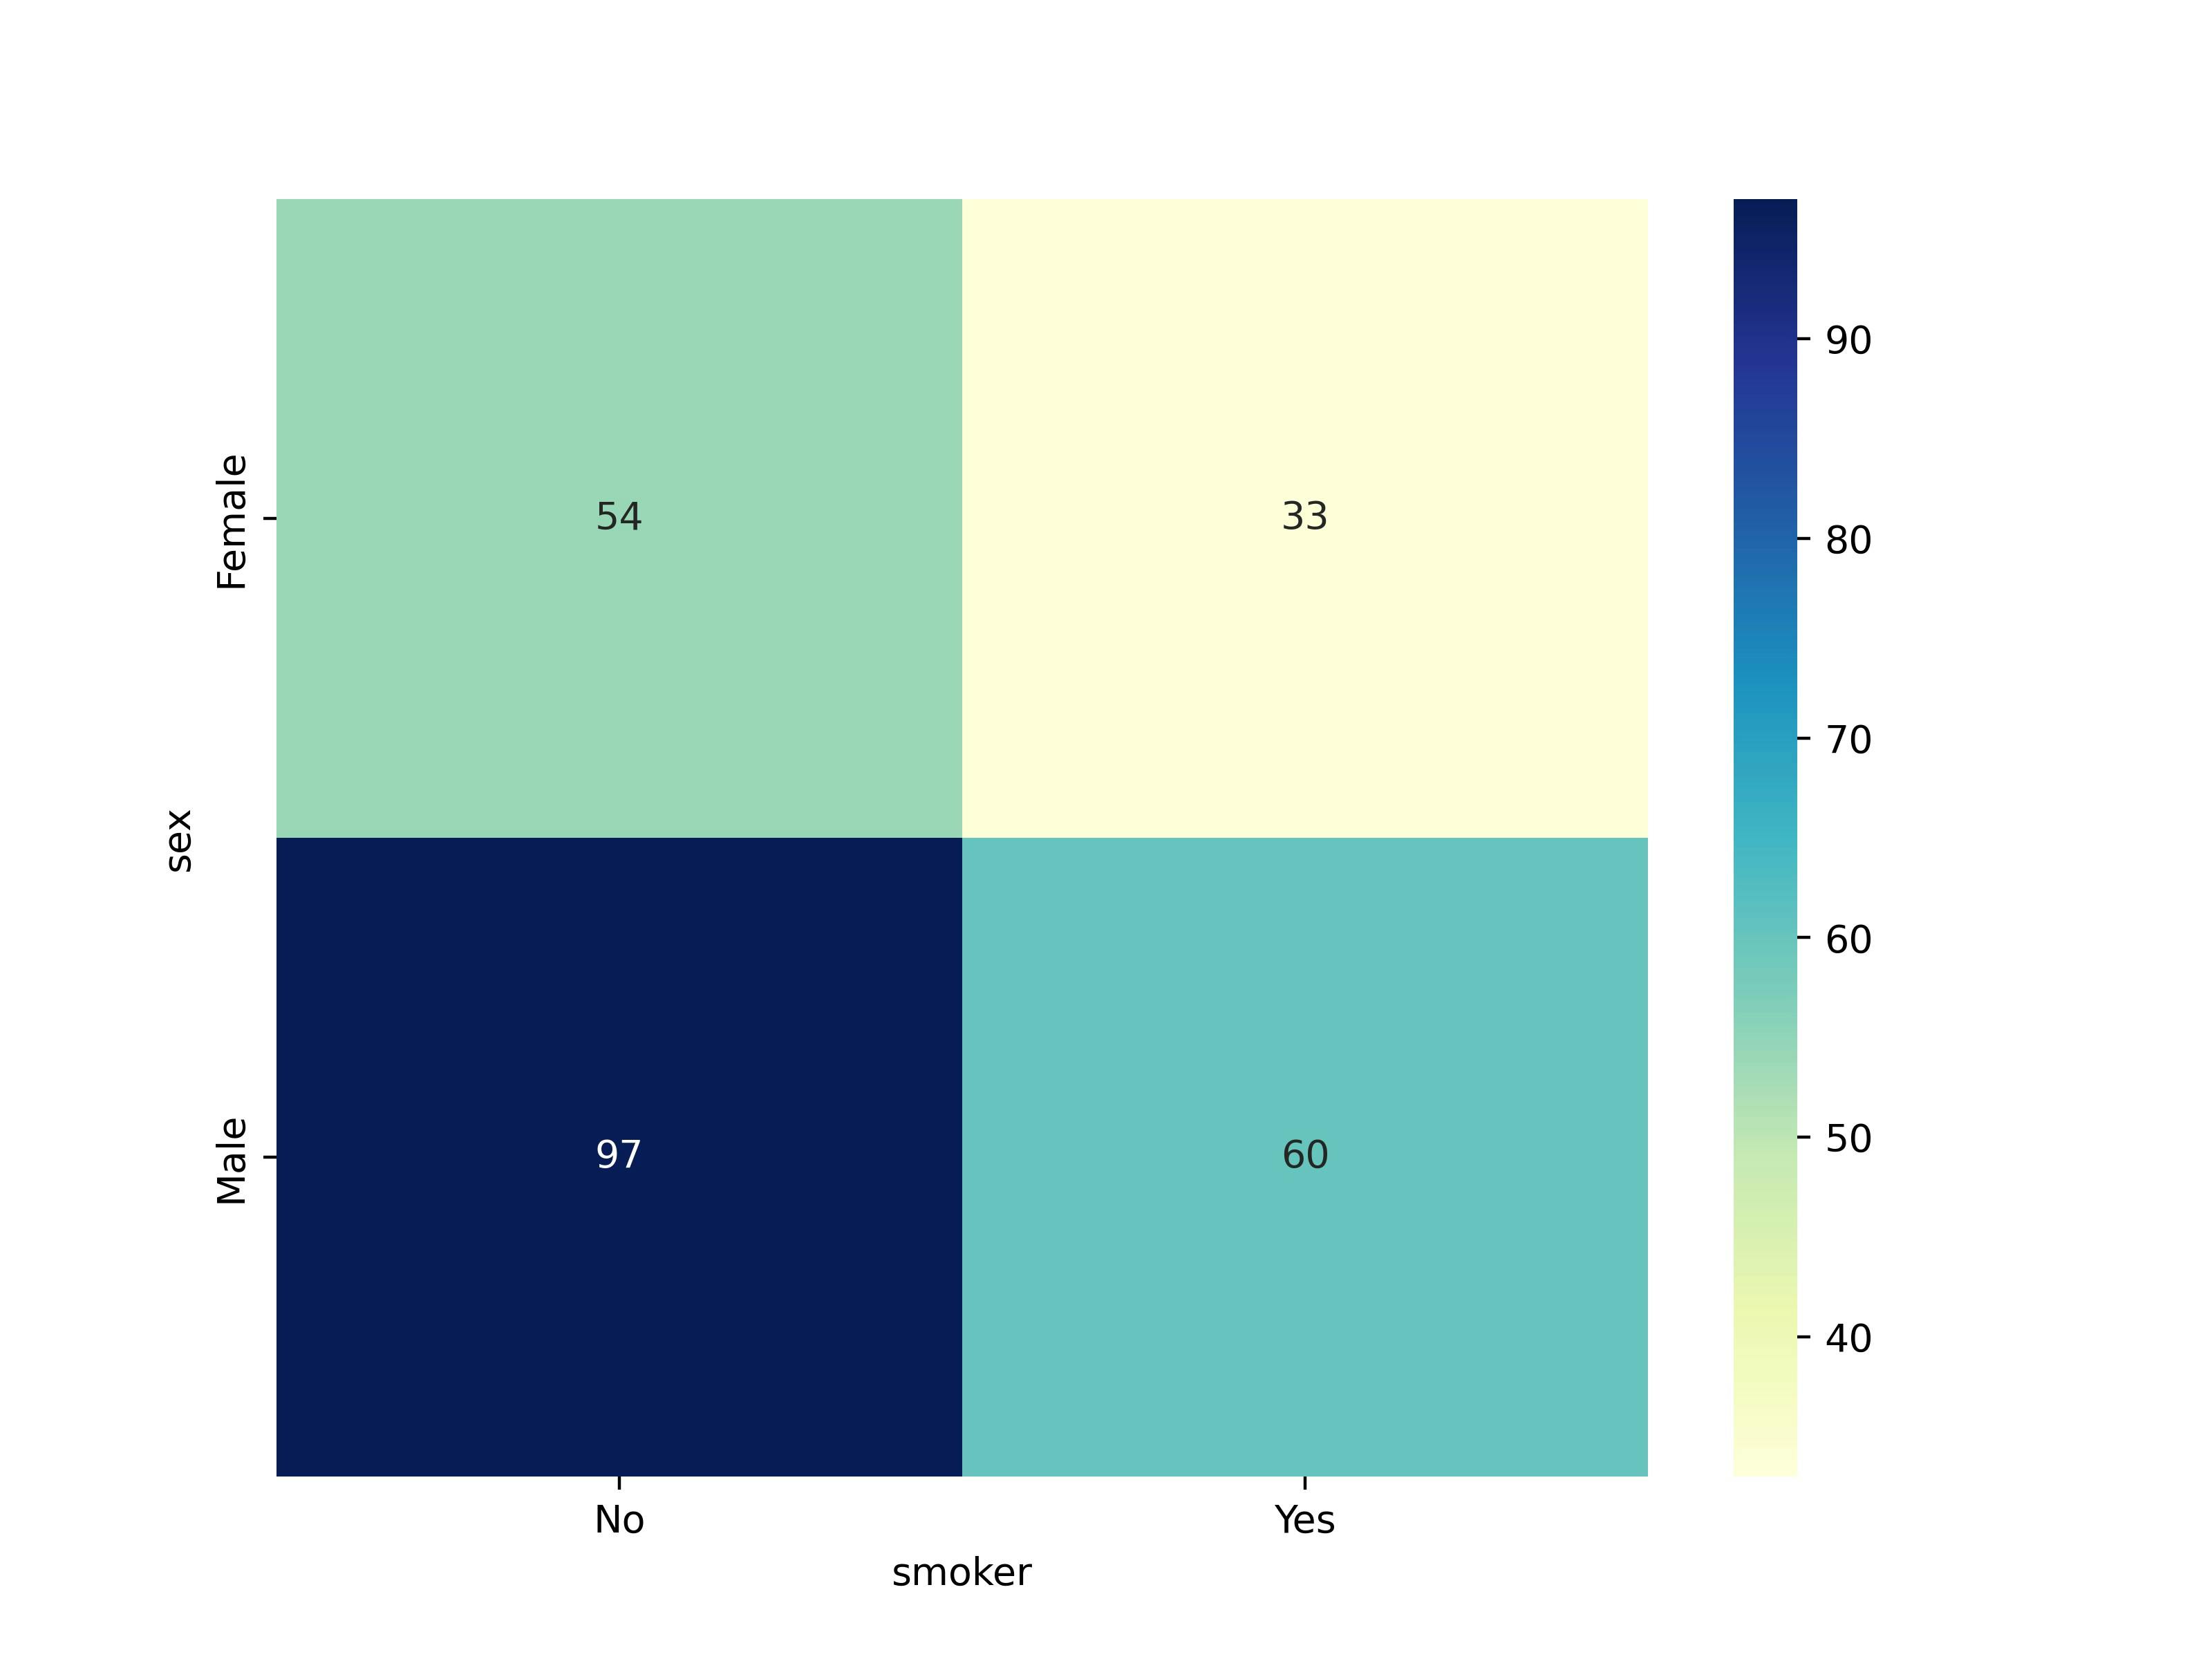
Step 3: Creating a Contingency Table 📊
Our investigation begins with the creation of a contingency table. This table helps us visualize the relationship between two categorical variables - in our case, "sex" and "smoker."
dataset_table = pd.crosstab(dataset['sex'], dataset['smoker'])
plt.figure(figsize=(8, 6))
tips = sns.heatmap(dataset_table, annot=True, fmt="d", cmap="YlGnBu")
figure = tips.get_figure()
figure.savefig('tips_heatmap.png', dpi=400)
plt.xlabel('Smoker')
plt.ylabel('Sex')
plt.title('Contingency Table Heatmap')
plt.show()
Step 4: Observing the Evidence 🕵️♀️
Let's take a closer look at the observed values from our contingency table:
Observed_Values = dataset_table.values
print("Observed Values: -\n", Observed_Values)
These observed values are the raw counts of each category combination.
Step 5: Launching the Investigation 🚀
Now comes the moment of truth! We perform the Chi-Square Test to see if there's a significant association between the two categorical variables - "sex" and "smoker."
result = stats.chi2_contingency(dataset_table)
The result now holds the Chi-Square statistic, p-value, degrees of freedom, and expected frequencies.
Step 6: Uncovering the Truth 🧐
Our investigation leads us to calculate the Chi-Square statistic, which will reveal if the observed values match our expectations:
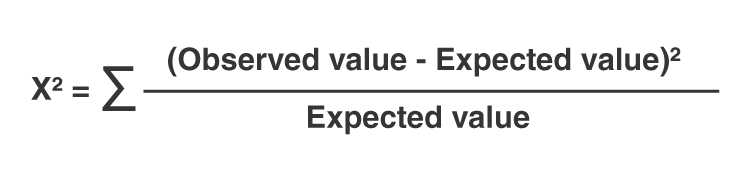
Expected_Values = result[3]
chi_square = sum([(o - e) ** 2.0 / e for o, e in zip(Observed_Values, Expected_Values)])
chi_square_statistic = chi_square[0] + chi_square[1]
print("Chi-Square Statistic: -", chi_square_statistic)
This statistic is a measure of how closely the observed and expected values align. A high statistic indicates a strong association.
Step 7: Setting the Scene 🎭
In our investigation, the critical value sets the stage. We need to find the critical value for our significance level (usually 0.05) and degrees of freedom.
alpha = 0.05  # Significance level
ddof = (no_of_rows - 1) * (no_of_columns - 1)  # Degrees of freedom
critical_value = chi2.ppf(q=1 - alpha, df=ddof)
print('Critical Value:', critical_value)
The critical value acts as a threshold for our Chi-Square statistic. If the statistic surpasses this value, we can reject the null hypothesis.
Step 8: Solving the Mystery 🧩
Our investigation comes to a climax with the calculation of the p-value, which will determine our final verdict:
p_value = 1 - chi2.cdf(x=chi_square_statistic, df=ddof)
print('P-Value:', p_value)
The p-value represents the probability of observing our Chi-Square statistic. If it's less than our significance level, we can reject the null hypothesis.
Step 9: Delivering the Verdict 📜
Finally, the moment of truth arrives! Let's interpret the results:
if chi_square_statistic >= critical_value:
    print("Reject H0, There is a relationship between 2 categorical variables")
else:
    print("Retain H0, There is no relationship between 2 categorical variables")

if p_value <= alpha:
    print("Reject H0, There is a relationship between 2 categorical variables")
else:
    print("Retain H0, There is no relationship between 2 categorical variables")
We compare the Chi-Square statistic to the critical value and the p-value to the significance level. If the statistic is greater than the critical value or the p-value is less than our significance level, we reject the null hypothesis, indicating a relationship between the categorical variables.
Step 10: Wrapping Up 🎁
Congratulations! You've successfully completed a Chi-Square Test, from loading the data to delivering a verdict. This test is invaluable for detecting associations in categorical data, and now you have the tools to apply it to your own datasets.
Stay tuned for more data exploration adventures! 🚀📊